Data Storyteller Workbench
BETASign In to Secure Your Workspace
For your privacy, every file is processed in a secure, private session. Sign in to upload your data and create visualization and data story.
Transform Your Charts into Compelling Stories
BETAOur AI-powered service analyzes your visualizations and instantly generates clear, actionable narratives, saving you hours of manual interpretation.
The Challenge: Chart Overload
Creating a chart is easy. But manually interpreting trends, identifying key insights, and writing a clear summary takes time and expertise. This crucial step is often a bottleneck, delaying decisions and hiding the true story in your data.
The AI Co-Pilot Solution
With a single click, our AI acts as your personal data analyst. It meticulously analyzes your chart—from bar and line graphs to scatter plots—and synthesizes the findings into a human-like narrative, ready to share.
Why You'll Love AI Data Storytelling
Accelerate Insight Discovery
Instantly identify critical takeaways and significant trends without manual effort. Never miss what matters.
Enhance Data Communication
Clearly communicate complex findings to any audience. Perfect for reports, presentations, and stakeholder updates.
Improve Decision-Making
Make faster, more informed decisions based on context-rich summaries and solid data evidence.
Tailored Narratives for Every Chart Type
Our AI is trained to understand the unique nuances of different visualizations, ensuring the story is always relevant.
Bar Charts
Line Charts
Scatter Plots
Pie Charts
Histograms
From Data Points to Decision Points
A chart shows the numbers. A story makes you understand them. Turn visuals into clear, persuasive narratives—instantly.
Deconstructing the AI‑Generated Narrative
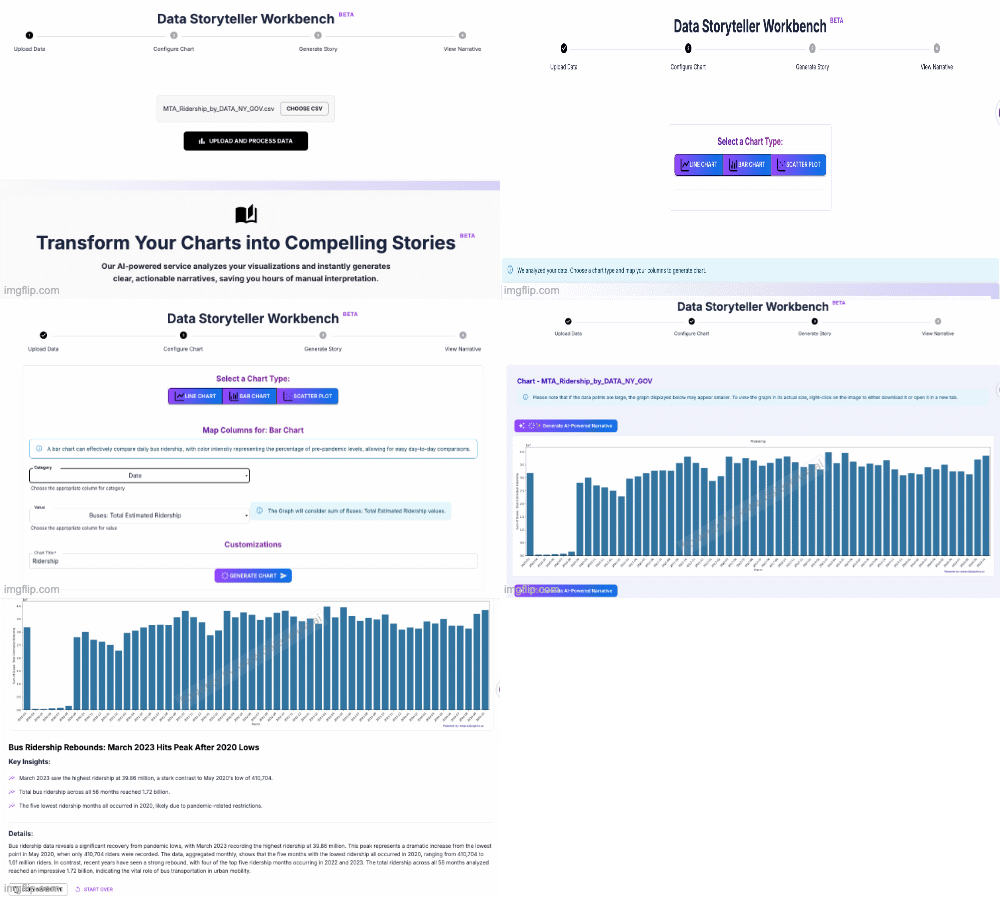
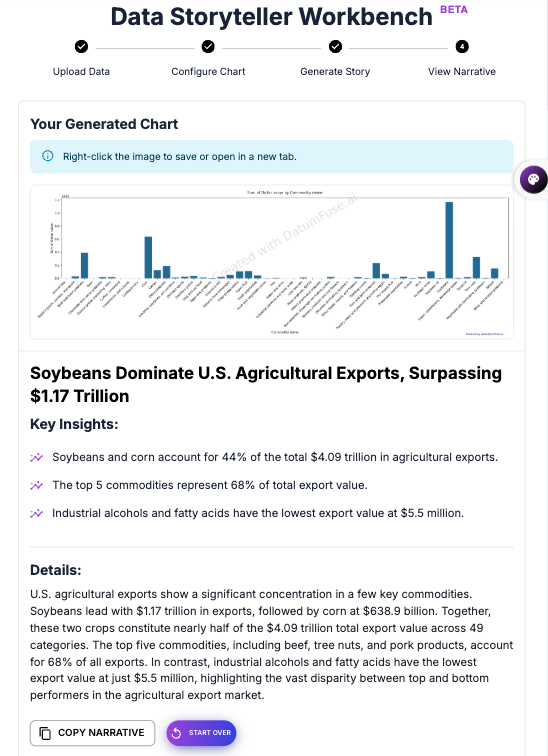
Our AI constructs a professional, multi‑faceted data summary built for clarity and impact. Every narrative includes three key components:
The Compelling Headline
A powerful one‑sentence headline that captures the single most important finding—your executive summary.
Key Insights (Bulleted)
A scannable list of statistically significant trends, outliers, and notable data points for quick takeaways.
The Detailed Paragraph
A coherent, human‑like narrative that adds context, explains relationships, and ties the insights together.
Who is AI Data Storytelling For?
Business Intelligence (BI) Analysts
Slash the time to draft weekly/monthly reports. Use AI text as a high‑quality first draft, then add strategic context.
Marketing Agencies
Deliver lightning‑fast reporting. Turn campaign visuals into concise summaries that prove value to clients.
Founders & Executives
Get the bottom line—fast. Convert complex dashboards into clear, executive summaries for confident decisions.
Sales Teams
Understand territory performance quickly. Generate narratives that spotlight top regions or products.
“The goal is to provide good data for better decisions. Data storytelling is the key to doing that.” — The AI Journal
Frequently Asked Questions
1) How accurate is the AI‑generated narrative?
Narratives are produced by advanced LLMs that interpret the statistical properties of your charted data. They’re ideal as a fast, factual first look—then reviewed and refined with your business context.
2) Can I edit the AI‑generated text?
Yes. Output is plain text for easy copy‑paste into docs, emails, or slides—edit and augment it in seconds.
3) What is Natural Language Generation (NLG)?
NLG is AI that converts structured data into human‑readable text. Our Storyteller applies modern NLG tailored for BI and reporting.
4) Is this the same as ChatGPT?
It shares similar foundations (LLMs) but is specialized for one task: interpreting charts and generating data‑driven narratives using visualization principles.
Generate clear, persuasive data stories—on demand
Stop spending hours on manual interpretation. Communicate findings with speed, clarity, and impact.


